InfraWatch Architecture: A High-Level Overview of a Distributed Automation Platform
When I started building InfraWatch, the goal was simple: automate the repetitive health checks and post-incident audits we used to perform manually for our clients.
Over time, it turned into something much more ambitious: a distributed monitoring platform capable of observing complex hybrid infrastructures, from on-prem AD forests to Azure workloads, in a consistent, automated, and scalable way.
This post is a walkthrough of the current state of InfraWatch’s architecture, what components exist today, how they fit together, and the principles that guided their design.
Design Goals
Before diving into the components, I had to make a few design principles non-negotiable:
- Scalability: handle hundreds of monitored endpoints and multiple client environments without rewriting the system.
- Modularity: each subsystem (collection, transport, processing, storage, UI) evolves independently.
- Security: isolation by tenant, encryption everywhere, and least-privilege communication.
- Automation-first: everything from deployment to updates runs through CI/CD pipelines.
- Vendor neutrality: Azure is the backbone today, but the stack remains portable to other clouds or self-hosted clusters.
These ideas became the backbone of the current high-level architecture.
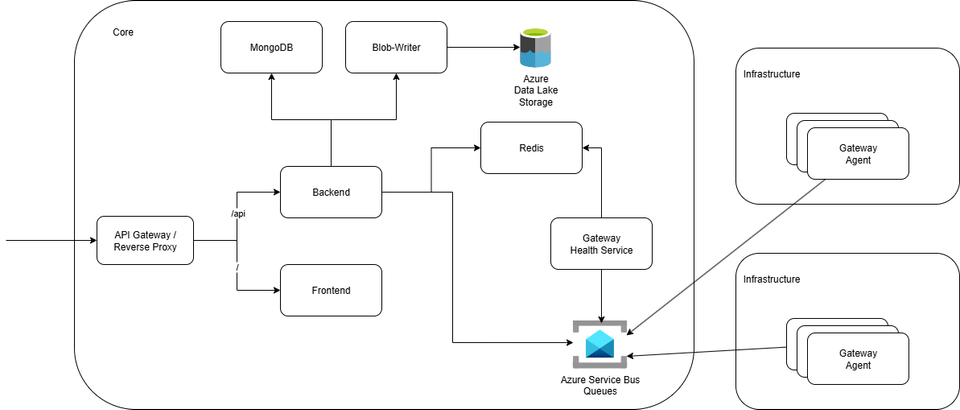
Core Components
InfraWatch is made up of several layers, each responsible for a specific piece of the monitoring workflow.
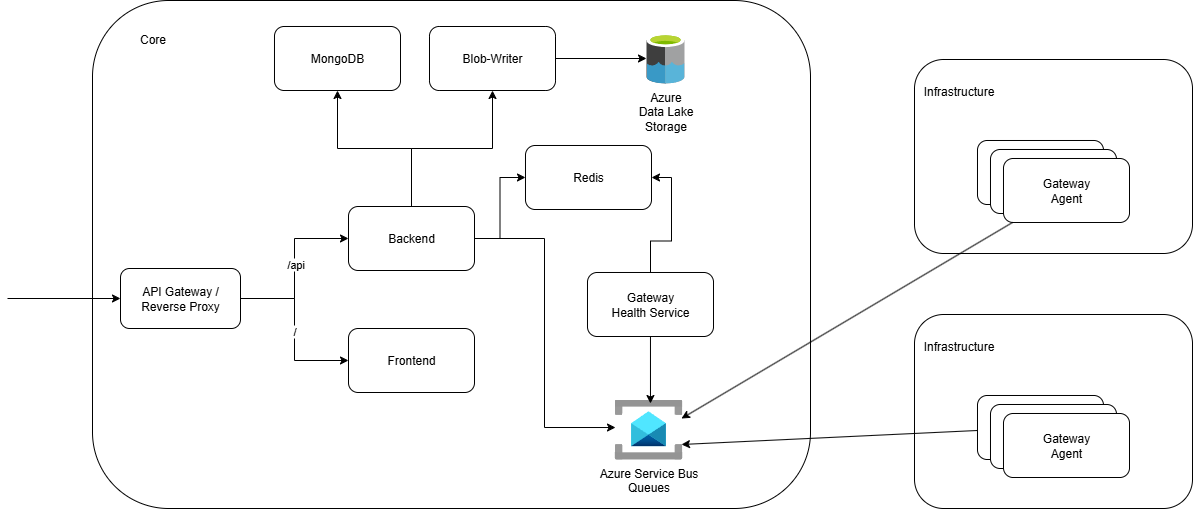
1. Application Gateway
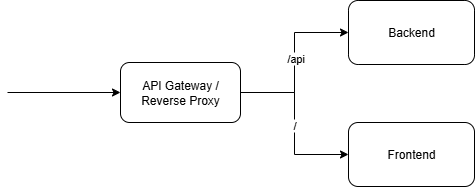
At the entry point of the platform sits the Application Gateway, acting as a reverse proxy that routes and secures all incoming traffic. Its primary role is to provide a single, consistent access layer for both users and external services.
Its main functions include:
- Path based routing
- / : routes to the frontend interface
- /api/ : routes to the backend interface(s)
- Load-balancing and independent scaling of front- and backend
- Handle TLS termination to simplify external certificate usage and management
By placing the reverse proxy in front of all services, the platform gains flexibility, security, and observability without coupling those concerns directly into the application code.
2. Frontend
The frontend of InfraWatch is built with Angular and RxJS, focusing on clarity and responsiveness in the data sense rather than the visual one. Its main goal is to display live infrastructure status efficiently, not to win design awards.
The interface is intentionally simple. It shows the current state of gateways, infrastructures, and endpoints in real time, thanks to a reactive data layer powered by RxJS. Users can immediately see changes in availability, health checks, and connectivity without needing to refresh or navigate away.
Three principles guide its design:
- Simplicity: focus on information, not decoration.
- Consistency: shared components and layouts make navigation predictable.
- Live-state updatability: data streams reflect the real system state as it changes.
I am not a frontend expert, and I do not pretend to be one. On some days, centering a single div still feels like a victory. But this simplicity works.
The UI is fast, reliable, and gets out of the way so the platform’s functionality can take center stage.
3. Backend
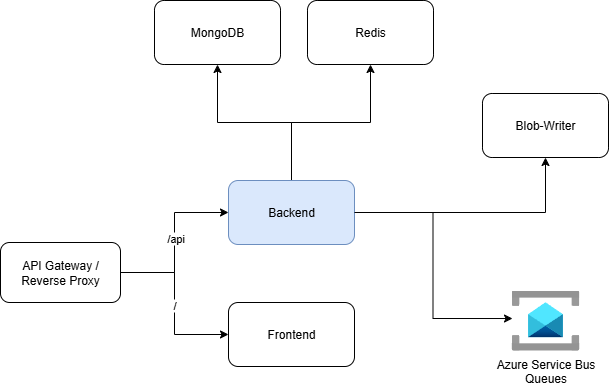
The backend is the core of InfraWatch. Its main responsibilities include:
- Managing authentication and authorization for both users and gateway agents.
- Handling API requests from the frontend and relaying commands and queries to the appropriate queues.
- Processing incoming messages from the Service Bus and persisting results in MongoDB, and/or relaying to the Blob-writer service discussed later.
- Exposing REST endpoints that unify all operational data into a single interface.
The backend was designed to be stateless and lightweight, allowing multiple instances to run concurrently behind the gateway.
It serves as the central coordination point between the user interface, data layer, and distributed agents while maintaining a clear separation of concerns.
Keeping the backend as a single service at this stage ensures simplicity and faster iteration, while leaving room to evolve into smaller specialized services as the platform grows.
4. MongoDB
InfraWatch uses MongoDB as its primary operational database. The decision to use a document-oriented model comes from the need for flexibility and rapid iteration.
The database is organized around four main entities:
- Enterprise: represents the top-level tenant or organization.
- Infrastructure: groups related assets within an enterprise, such as a datacenter, a site, or a cloud environment.
- Gateway: represents the deployed agent that collects data and interacts with the platform.
- Endpoint: stores detailed information and health data about individual monitored systems.
- User: are authenticated users that have access rights (Read/Write/Execute) on a given infrastructure.
Each document structure is designed to evolve independently as new monitoring capabilities are added, avoiding schema rigidity while still maintaining clear relationships through identifiers and metadata.
For now, MongoDB runs as a standalone replica set, providing basic redundancy and the ability to scale reads and writes horizontally in the future, although it is highly unlikely this would ever be needed given the data model.
5. Gateway Agent
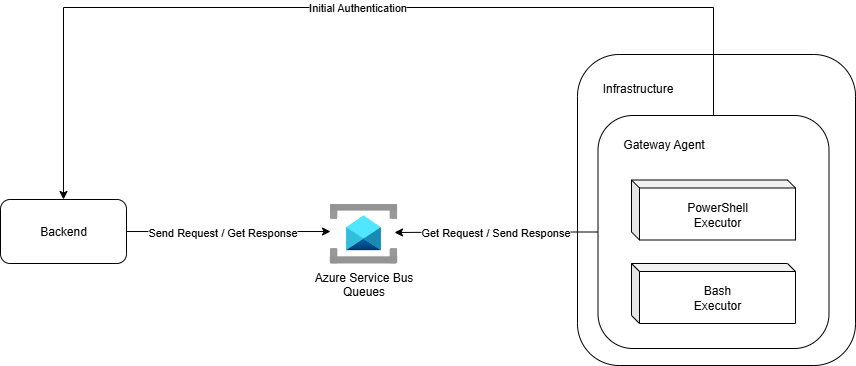
The Gateway Agent is the edge/on-premises component of InfraWatch. It is deployed within client environments and acts as the bridge between the core platform and the internal customers' infrastructures and cloud platforms.
Upon startup, the agent authenticates with the backend to obtain the configuration and credentials required to connect to the appropriate Service Bus queues. From there, it begins sending collected data, executing scheduled checks, and reporting system health through secure outbound communication only.
This design avoids any need for inbound connectivity, reducing exposure and simplifying deployments in restricted or segmented networks. Each agent operates independently, ensuring that the monitoring of one client or site does not affect others.
The Gateway Agent will be covered in more detail in a later post, where I will explore its internal architecture, collector system, and how it maintains reliability under unstable network conditions.
6. Azure Service Bus Queues
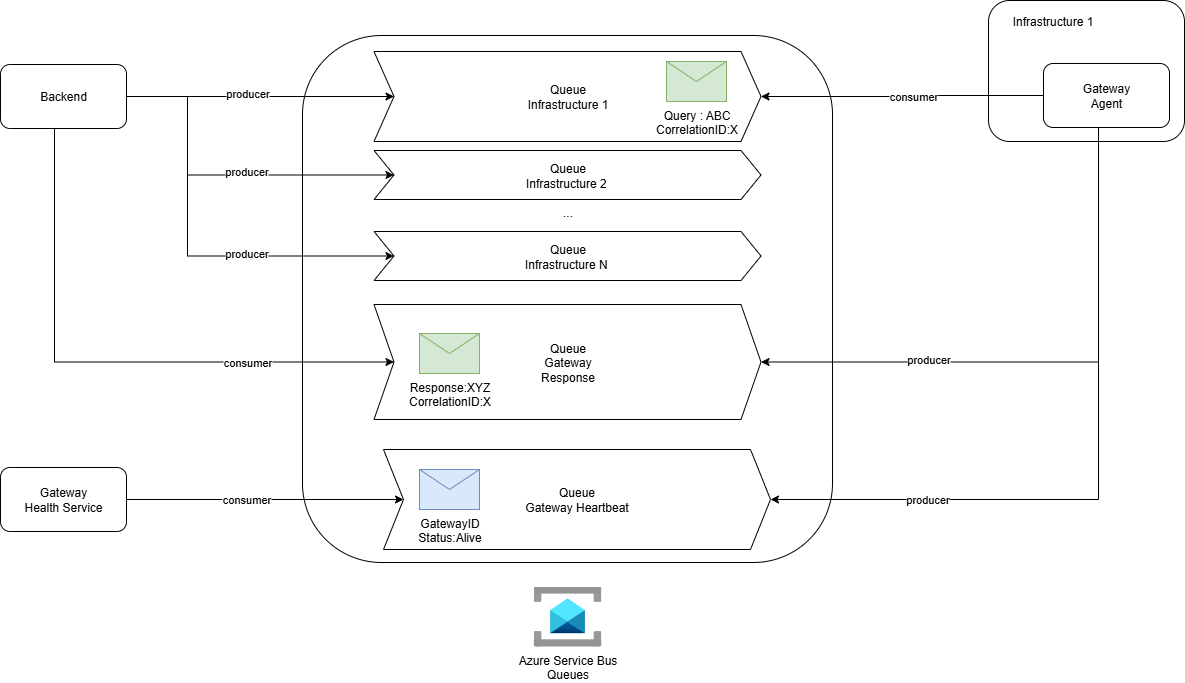
Azure Service Bus is the backbone of InfraWatch’s communication model.
It provides the asynchronous messaging layer that connects the backend and distributed gateway agents without requiring any inbound connectivity to client infrastructures.
Each monitored infrastructure has its own dedicated queue, along with specialized queues for script responses and heartbeats. This design isolates communication per environment and improves both scalability and security.
Messages are sent and received using correlation IDs, allowing the system to match responses to the correct requests even when multiple operations are running in parallel. Built-in features like durability, retry policies, and dead-letter queues ensure that no message is lost, even during transient network or service interruptions.
The use of Service Bus eliminates the need for direct access between InfraWatch and customer environments. It introduces natural asynchronicity between requests and responses, which makes the platform more resilient, easier to scale, and inherently secure.
7. Redis & Gateway Healthcheck Service

Redis plays a key role in maintaining the live status of InfraWatch’s distributed agents. It acts as a fast, in-memory data store that keeps track of gateway heartbeats and their current availability state.
Gateway agents periodically send heartbeat messages through the Service Bus. These messages are handled by a dedicated gateway healthcheck service, which updates Redis accordingly. This separation ensures that the main backend remains focused on API and data processing tasks instead of being burdened by real-time state management.
Redis stores a lightweight map of gateway identifiers and their last-seen timestamps, allowing the backend to quickly determine whether an agent is active or inactive. The frontend retrieves this information through the API and reflects it in real time.
This approach provides both speed and simplicity. Redis keeps InfraWatch responsive even when monitoring dozens or hundreds of agents, while avoiding unnecessary database reads or heavy processing for a task that only needs short-term persistence.
8. Blob-writer
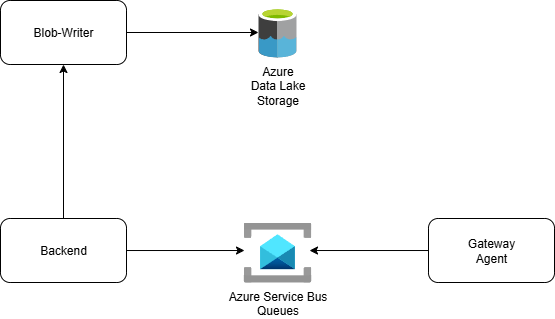
The Blob-writer service is responsible for offloading large or asynchronous data operations from the backend. Its primary task is to write collected reports, logs, and other structured files to Azure Data Lake Storage without affecting the responsiveness of the main API.
When the backend receives data through the service bus queues, it offloads the message payload to the Blob-writer through the internal queue system. The Blob-writer then performs the storage operation asynchronously.
This design isolates I/O-intensive workloads from the core application logic, improving both scalability and reliability. It also ensures that user-facing operations remain fast, even when large uploads or exports are in progress.
By delegating this responsibility to a separate service, InfraWatch gains better control over retry logic, batching, and error handling, while keeping the backend focused on orchestration and business logic.
7. Azure Data Lake Storage
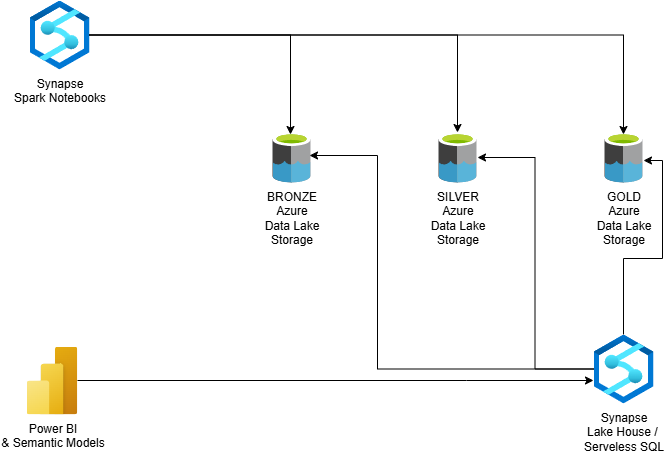
Azure Data Lake Storage (ADLS) serves as the long-term data layer of InfraWatch. It is where all collected infrastructure data eventually lands once processed.
The decision to use a data lake comes from two main requirements:
- The ability to store large volumes of unstructured data, such as JSON reports, logs, and diagnostic exports.
- The need for advanced analytics that go beyond operational monitoring.
The data layer is currently being integrated with Azure Synapse, which allows the use of Spark and serverless SQL to analyze large datasets directly within the lake. This integration provides an easy path to building analytical models, aggregating metrics, and exposing insights to dashboarding tools such as Power BI.
This layered approach separates operational data stored in MongoDB from analytical and historical data in the lake. It keeps the live system fast while enabling deep analysis of trends, correlations, and long-term behavior across all monitored infrastructures.
Conclusion
InfraWatch has evolved into a distributed system built around clear boundaries and independent components. Each part has a defined responsibility: the gateway collects, the queues connect, the backend processes, and the data layers persist and analyze.
This modular design keeps the platform simple to reason about while remaining flexible enough to scale and integrate new capabilities over time. It is not the final form, but a solid foundation — one that balances practicality with long-term vision.
Next, I plan to dive deeper into one of these building blocks, starting with the Gateway Agent, its internal design, the reasons that motivated each choice, and the way it enables secure and autonomous monitoring across diverse infrastructures.