Introducing InfraWatch

Over the years, I’ve helped companies design and operate complex infrastructures whether it's on-premises, in the cloud, or somewhere in between.
No matter how advanced the environment was, one thing always stood out: health checks & audits remained too fragmented, too manual, and/or too reactive.
That’s the problem InfraWatch is built to solve.
What it is
InfraWatch is a side project I’m developing to automate infrastructure health checks and audits.
It’s designed for hybrid environments where you might have servers, containers, and cloud resources spread across multiple tenants or clients — all needing consistent visibility.
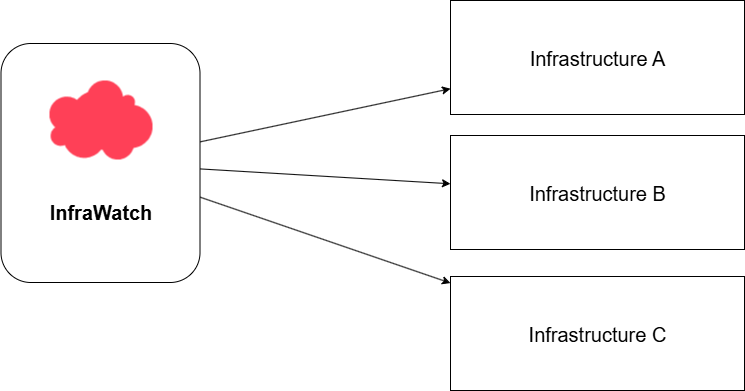
Instead of adding another monitoring tool, InfraWatch acts as an orchestrator: it connects to existing systems, runs automated health checks, aggregates results, and presents a clear picture of what’s actually happening.
Why it matters
In managed service environments, keeping infrastructures healthy often means endless dashboards, scripts, and reports; all slightly different for each client.
That doesn’t scale.
Teams waste time collecting data instead of interpreting it, and alerts often tell you something went wrong without helping you understand why.
InfraWatch aims to reduce that noise by automating the repetitive parts of monitoring, standardizing checks, and turning raw data into actionable insights.
How I’m approaching it
InfraWatch is built around a simple idea: distributed automation.
Each environment runs lightweight agents that collect and validate data, sending results securely to a centralized backend.
From there, dashboards and reports are automatically generated, giving MSPs and IT teams a real-time, unified view of infrastructure health.
This project is both a personal initiative and part of my master’s research on scalable, secure monitoring systems.
In future posts, I’ll share more about the architecture, design iterations, and what I’m learning as InfraWatch evolves.